Written by

Daniel Kryszkiewicz
End-to-end analytics case study for pharma distribution: CSV data, Azure Data Factory, Azure PostgreSQL, SQL modelling and Power BI reporting.
Project at a glance · Business problem · Data workflow · Key insights · Recommendations · Business value
Project at a glance
Client context: Pan-European pharmaceutical distribution / 3PL operation — illustrative NordPharma scenario.
Scale analysed: 166K shipments · €27.23bn cargo value · 10 carriers · FY2021–2023
Data stack: CSV → Azure Data Factory → Azure PostgreSQL → SQL modelling → Power BI
Business outcome: One decision-ready view of delivery reliability, GDP compliance, carrier performance and financial exposure.
The business problem
Pharmaceutical distribution teams need to manage service reliability, GDP compliance and financial exposure at the same time. In many operations, shipment data, carrier invoices and compliance exceptions are still tracked across separate Excel or CSV files.
This creates no single source of truth. Carrier performance discussions rely on anecdotes, billing disputes surface late and financial risk is difficult to quantify before it affects cash flow, service quality or audit readiness.
The dashboard was designed to answer three operational questions:
Are we delivering on time — and which carriers are pulling performance down?
Where are we financially exposed through delays, disputed invoices and at-risk cargo?
Is GDP compliance strong enough to support audit readiness?
From raw CSV files to a decision-ready dashboard
The analysis was built as a repeatable analytics workflow, not a one-off spreadsheet. Raw shipment, carrier, invoice, trade-lane and compliance data was loaded from CSV files into Azure PostgreSQL using Azure Data Factory.
The data was then cleaned, normalised and prepared in SQL before being modelled in Power BI with DAX measures for operational and financial KPIs.
CSV → Azure Data Factory → Azure PostgreSQL → SQL normalisation → Power BI
KPIs measured
On-Time Delivery: 91.82%
Delay Rate: 8.18%
GDP Compliance: 93.37%
Total Cargo Value: €27.23bn
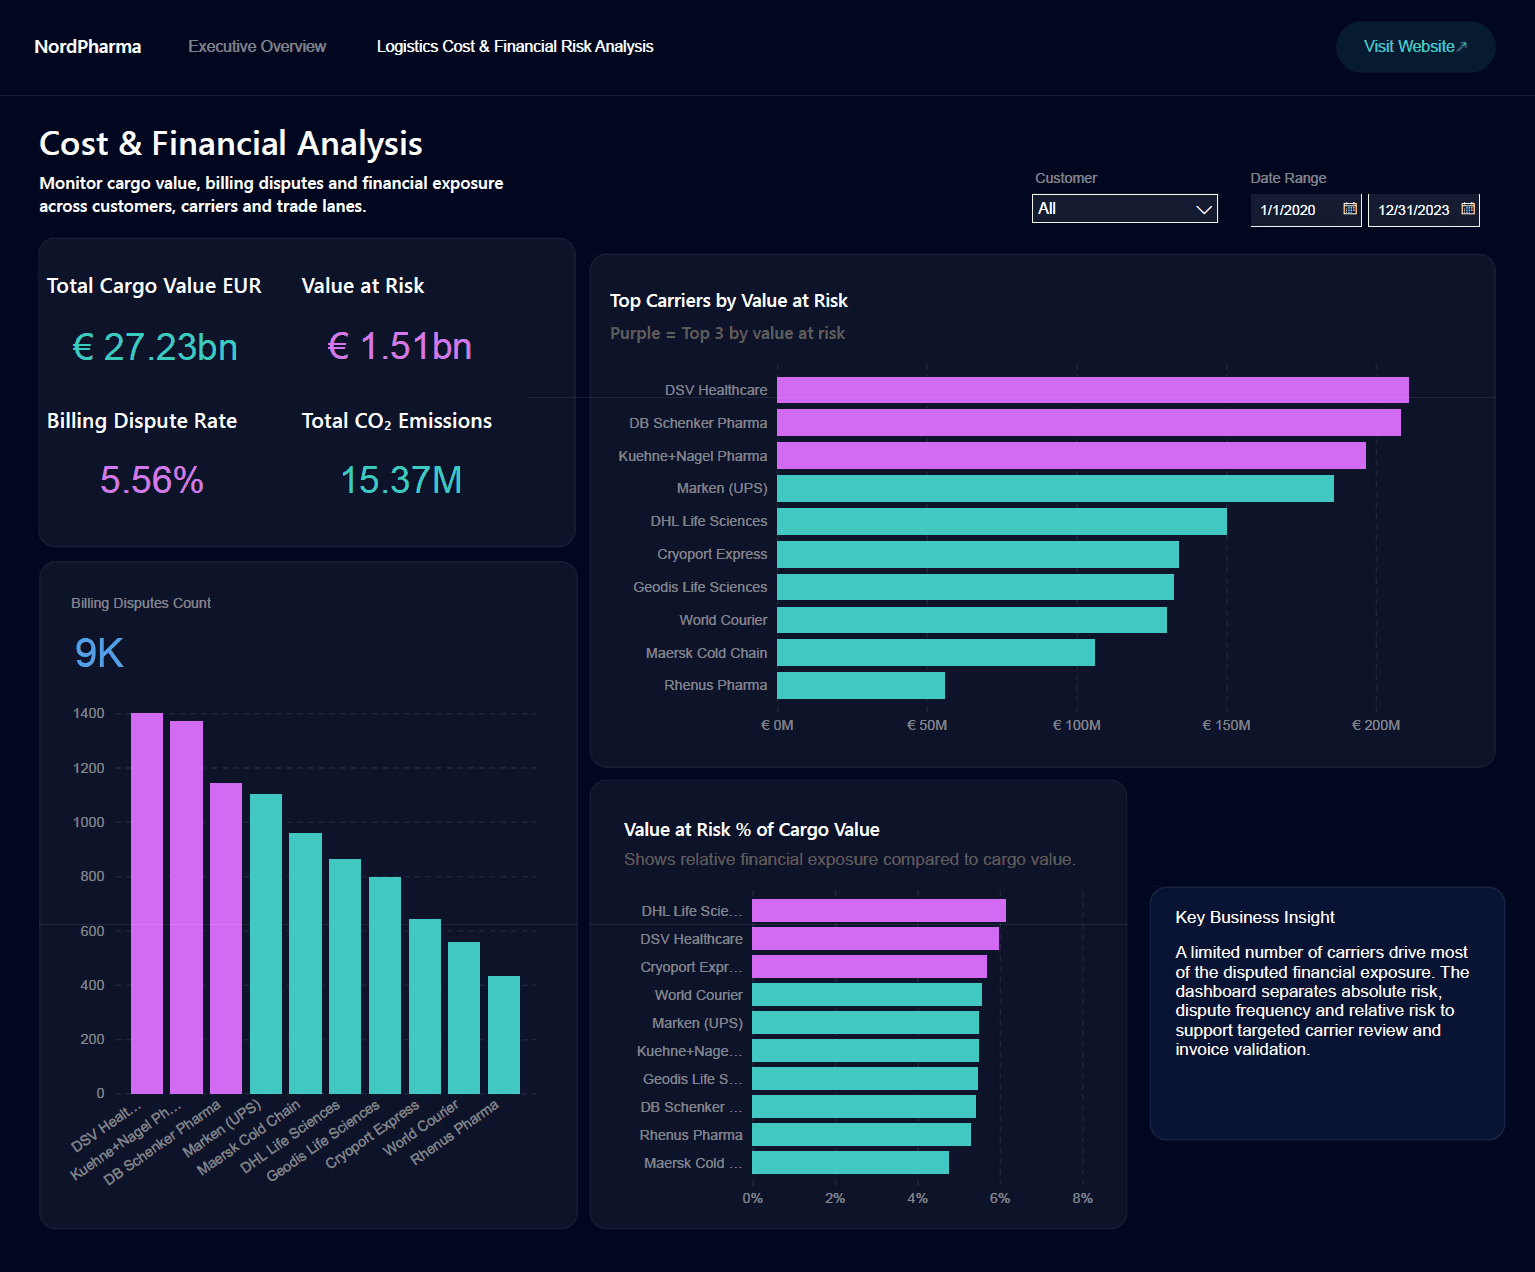
Value at Risk: €1.51bn
Billing Dispute Rate: 5.56%
Carrier OTD Spread: 97.10% → 87.09%
What the data revealed
1. Service reliability was solid, but below pharma expectations
OTD reached 91.82%, with an 8.18% delay rate. For pharma logistics, where high service reliability and GDP discipline matter, this performance gap creates operational and compliance risk.
2. Carrier performance was the biggest controllable lever
Carrier OTD ranged from 97.10% to 87.09%, showing a 10-point spread between the best and weakest performers. The delay problem was concentrated in a limited group of carriers, not across the full network.
3. Financial risk was concentrated in specific carriers
€1.51bn of cargo value was classified as at risk, with exposure concentrated among a small number of carriers. This makes mitigation more targeted and more practical.
4. Billing disputes pointed to operational friction
Around 9,000 billing disputes and a 5.56% dispute rate showed that financial leakage and service issues were connected, especially where weak delivery performance and dispute concentration overlapped.
Recommended actions
Structured carrier review
Review the bottom OTD performers using three years of OTD, delay and dispute data. Tie volume allocation to clear service-level expectations and remediation plans.
Invoice validation focus
Prioritise invoice validation for carriers generating the highest dispute volume. Even a small reduction in dispute rate can improve cash flow and reduce manual finance work.
GDP compliance monitoring
Promote GDP compliance to a recurring leadership KPI and track root causes behind exceptions, not only the final compliance percentage.
High-exposure lane controls
Apply additional controls to high value-at-risk lanes, including carrier selection, cold-chain reliability checks and explicit risk ownership.
Business value delivered
The dashboard replaces disconnected spreadsheet reporting with one decision-ready view of logistics performance, GDP compliance and carrier financial exposure.
Operations, finance and leadership can work from the same numbers, identify risk earlier, prioritise carrier actions and support decisions with data instead of manual reports or anecdotal feedback.
Better visibility over service reliability and compliance
Faster carrier performance reviews
Earlier detection of financial exposure
Less manual Excel / CSV reporting
Stronger link between operational KPIs and business decisions